
Note: The text in the asset uses the engine “Text3D” plug-in. This plug-in must be turned on, otherwise an error will be reported and cannot be used normally. It is recommended to enable the plug-in first and then import the assets into your project.
Make sure enabled project setting –>Substrate Materials, Substete opaque material rough refraction Substrate advanced visualization shaders.if not,the material is useless.
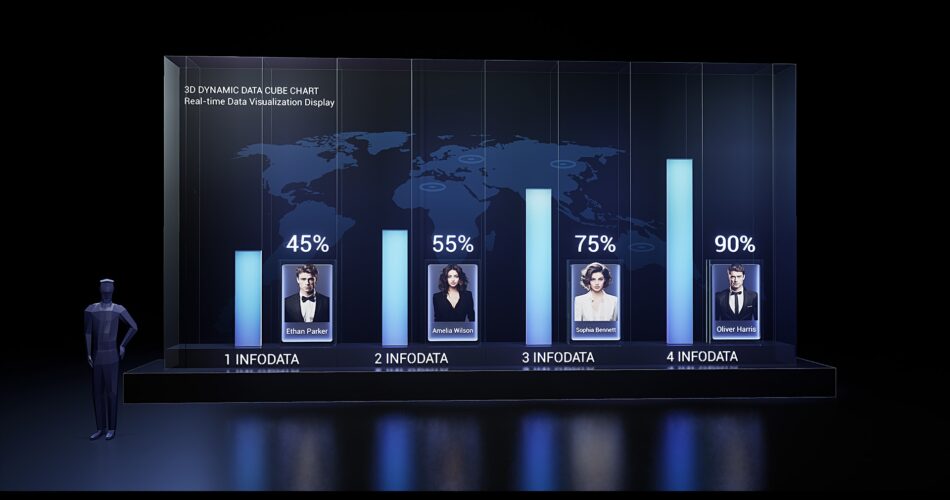
Overview: “3D Dynamic Data Cube Chart” is a dynamic 3D data visualization tool asset designed for real-time presentation of data. Assets include two modes of presenting data: percentage and voting. With its intuitive data cube chart, this tool allows you to quickly use it in data visualization projects and virtual studios out of the box.
Feature Highlights:
Real-time data update: Modify data in real time and update with one click.
Customized experience: Provides rich customization options, including color, number of Data Cubes, pictures, and text.
Animation and visual effects: appearance, hiding, smooth transition animation.
Data interface functions facilitate the use of other methods to transfer data.
Technical Details
Features:
- Static Meshes: 12
- Material Instance: 12
- Material: 19
- Texture: 33
- DataAsset: 7
- Structure: 2
- Number of Blueprints:7
- Copy Network: (none)
- Windows Support: (yes)